Carney Existing FormationsThe script searches historical data for XABCD harmonic formation patterns
Supported harmonic traiding formations:
Gartley
ButterFly
Bat
alt. Bat
Crab
Greate Crab
Shark
AB=CD
5-0
Cypher
Precise description and knowledge you can get from the Harmonic Trading book series by Scott Carney.
Script with limited access, contact author to get authorization
This version is showing formations in historical data only. There is a separate version that is trying to predict potencial formations in current data set.
Script settings:
Precision - How large deviations from the standard we accept
Last bars to search - How far in the fast we should look to check formations.
max points distance - How big patterns we are looking for.
Line color and width - To customize chart for your preferences
Show labels - You can pick format of formations labels.
Troubleshooting:
Result dialog error "Abandoned at ...." - Change "max points distance" to smaller value.
TraidingView (! character):
Loop takes too long to execute (>500ms) - Change "max points distance" to smaller value.
In case of any problems, please contact the author of the script.
在腳本中搜尋"the script"

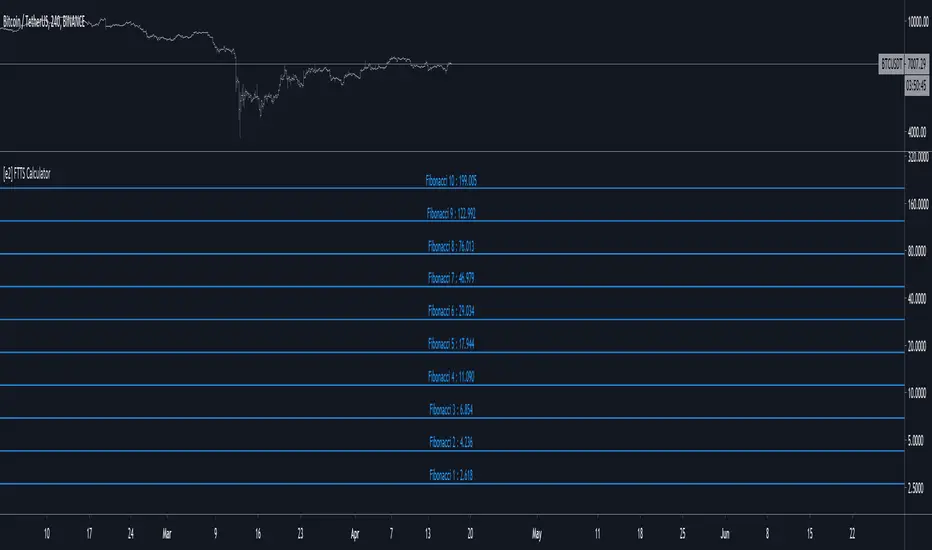
[e2] Fibonacci, Tribonacci, Tetranacci Sequence CalculatorThe script is a simple calculator to obtain numbers of Fibonacci, Tribonacci or Tetranacci Sequence.
The script contain calculations for constants (up to 16 digits) that could be used as one of the sequence's number.
The Calculator has 3 modes. Users can define the numbers to initialize the sequence in the options:
- The Fibonacci Sequence is the series of numbers, every next number is found by adding up the two numbers before it.
xn = xn-1 + xn-2
fiConst variable = Fibonacci Constant(Golden Ratio) - 1.61803...
"Classic" Sequence initialize with numbers {0, 1}. Output: 1,2,3,5,8,13,21...
To Calculate the Fibonacci Extensions the sequence should be initialized with {1, fiConst}. Output: 2.618, 4.236, 6.854...
- The Tribonacci Sequence is the series of numbers, every next number is found by adding up the three numbers before it.
xn = xn-1 + xn-2 + xn-3
trConst variable = Tribonacci Constant - 1.83929...
"Classic" Sequence initialize with numbers {0, 0, 1}. Output: 1,2,4,7,13,24...
To Calculate the Tribonacci Extensions the sequence should be initialized with {0, 1, trConst}. Output: 2.839, 5.679, 10.357...
- The Tetranacci Sequence is the series of numbers, every next number is found by adding up the four numbers before it.
xn = xn-1 + xn-2 + xn-3 + xn-4
teConst variable = Tetranacci Constant - 1.92756...
"Classic" Sequence initialize with numbers {0, 0, 0, 1}. Output: 1,2,4,8,15,29,56...
To Calculate the Tetranacci Extensions the sequence should be initialized with {0, 0, 1, teConst}. Output: 2.928, 5.855, 11.710...
The Calculator can return a single number or a set of numbers based on the selected sequence mode.
The script is made for other scripts integration rather than stand-alone usage.
The Opening Range / First Bar By Market Mindset - Zero To EndlesThe script shows the opening range of the instrument based on different resolutions and timeframes.
Inputs :
1. Resolution
It decides the calculation frequency of the script.
In Auto resolution, Standard values have been used.
2. Timeframe
It decides the timeframe for the OHLC values.
By default, it will use the chart timeframe and so chart OHLC values.
3. Lookback
It decides the no. of ranges shown on the chart.
Middle Line can be hidden from the settings.
The script can be used for any instrument and on any timeframe.
If price is above the opening range or the middle line, a trader should look for long opportunities.
If price is below the opening range or the middle line, a trader should look for short opportunities.
A sideways or choppy move is exoected if Middle line is crossed again and again.
For trading, wait for atleast 1st bar to close. and let the opening range build up first.
Happy Trading

Previous OHLCThe scripts places horizontal levels on your charts indicating the previous Daily, Weekly or Monthly OHLC values over the current timeframe.
Slightly modified version of Nanda86's "Previous OHLC" script. I corrected a couple of bugs and added more control over colors and labels in general. I also removed the hourly OHLCs.

[A618]Improved Wave channel 3D The Script is an Amalgamation of Two prominent Scripts in One
1. Ehlers 2 Pole ButterWorth Filter
2. Wave Channel 3D
Intuitively,
Buy when Candles are above all the filter Lines
Sell when Candles are below the Filter Lines
CREDITS

EMA analysis with Stoch OverSold/Bought indicator + IchimokuThe script will analyze trend around EMAs (configurable periods) and let you know when to short or long the market.
It will also tell you when there is a Overbought / Oversold Cross over Stochastic indicator
The script also includes a Ichimoku cloud so you can add this to your analysis for a trading action.
There will be more indicators coming into this script since im constantly working on Trading view scripts and analysing new strategys.
If you want access to it, contact me. (Its not free but also not expensive)
Best Regards.

Favorite Signals w/EMA FilterThe script combines my favorite signals then filters them with three EMAs.
Via the Style tab, you can choose to either have the signals color the bar and/or plot a shape above/below.
All signals can be turned off via the Inputs tab, which will remove the bar color and/or shape (if not already off in the Style tab) as well as remove the pattern from the alerts function.
Remember when using TV alerts, if you change the script settngs, you must create a new alert if you wish to be alerted for the changes you've made.
LONG/SHORT SIGNALS INCLUDED FOR:
- TD8s
- TD9s
- Hammer
- Shooting Star
- Bullish Harami
- Bearish Harami
- RSI Divergences
EMA FILTER LOGIC LONGS:
- Price < Fast EMA & Med EMA > Slow EMA = Possible Long Entry
- Price > Fast EMA & Med EMA > Slow EMA = Possible Reversal, Tighten Stop or Reduce Position
EMA FILTER LOGIC SHORTS:
- Price > Fast EMA & Med EMA < Slow EMA = Possible Short Entry
- Price < Fast EMA & Med EMA < Slow EMA = Possible Reversal, Tighten Stop/Reduce Position
Big up to @spdoinkal, @HPotter, @LonesomeTheBlue, for writing the originals scripts for the signals above.
Enjoy!
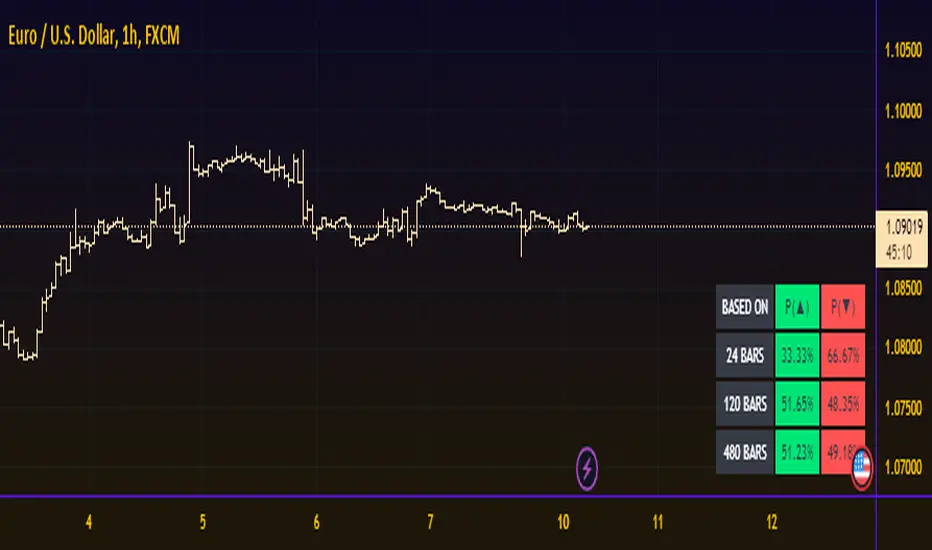
Probability TableThe script is inspired by user NickbarComb, I suggested checking out his Price Convergence script.
Basically, this script plots a table containing the probability of the current candle closing either higher or lower based on user-define past period.
Hope that it will be helpful.
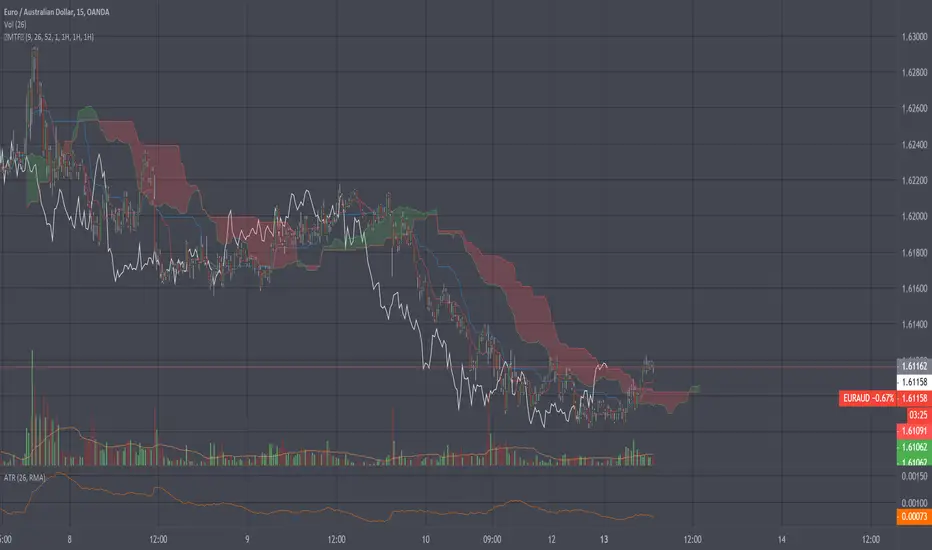
Ichimoku Kinkō hyō Keizen 改善
The script is not finnished yet and show's an other interpretation of how it could be scripted
Step -1 is complete... Basic Ichimoku with asjutable length and editable lines colors and visibilities.
Step -2 in progress... Adding ability to une multiple Spans, sens and Kumo on higher and lower timeframe.
Your Step : Like and Share ;) have a good year 2020 !
2020-01-06 /--------/ -R.V.
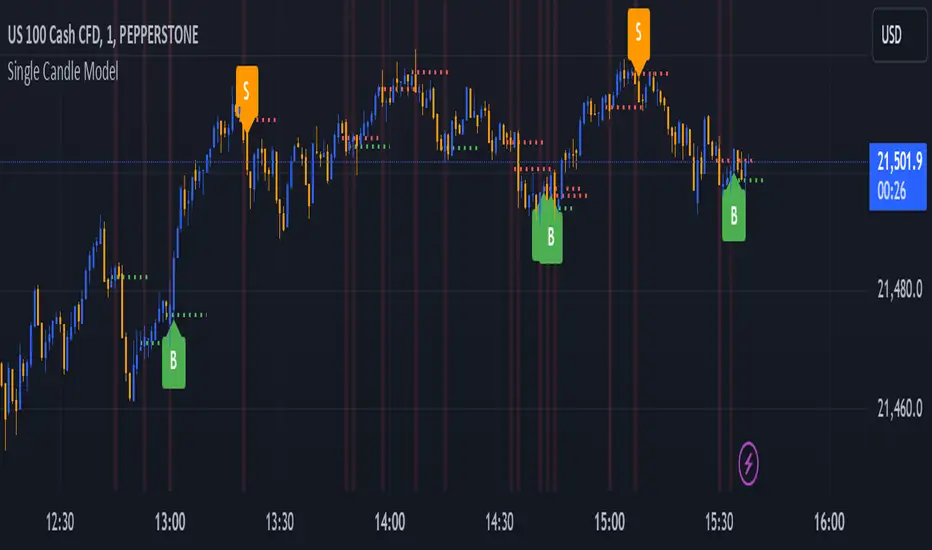
Single Candle Model-DTFXThe script identifies the candles with engulfing body and marks the 50% of the candle for easy entry based on model of #DTFX single candle entry
Interpreting the Signals:
Look for candles labeled as "BE". These represent significant price action where the range is larger than the previous candle's range.
Pay attention to the 50% line of the "BE" candle:
A green line indicates a bullish "BE" candle.
A red line indicates a bearish "BE" candle.
Watch for Buy ("B") and Sell ("S") labels:
"B": Indicates a potential bullish breakout.
"S": Indicates a potential bearish breakdown.
Alerts:
Configure alerts in TradingView to notify you whenever a "B" or "S" signal is detected. This allows you to act on the signals without constantly monitoring the chart.
Use in Trading Strategies:
Combine this indicator with other tools like support/resistance levels, moving averages, or trend analysis to validate the signals.
Use the midpoint (50% line) of the "BE" candle as a potential reference point for stop-loss or target levels.
Customizations:
Adjust the appearance of labels and lines by modifying their style, color, or placement in the script.
Add filters (e.g., timeframes or volume conditions) to refine the detection of "BE" candles.
This indicator helps traders identify pivotal price movements and act on potential breakouts or breakdowns with clear visual markers and alerts.
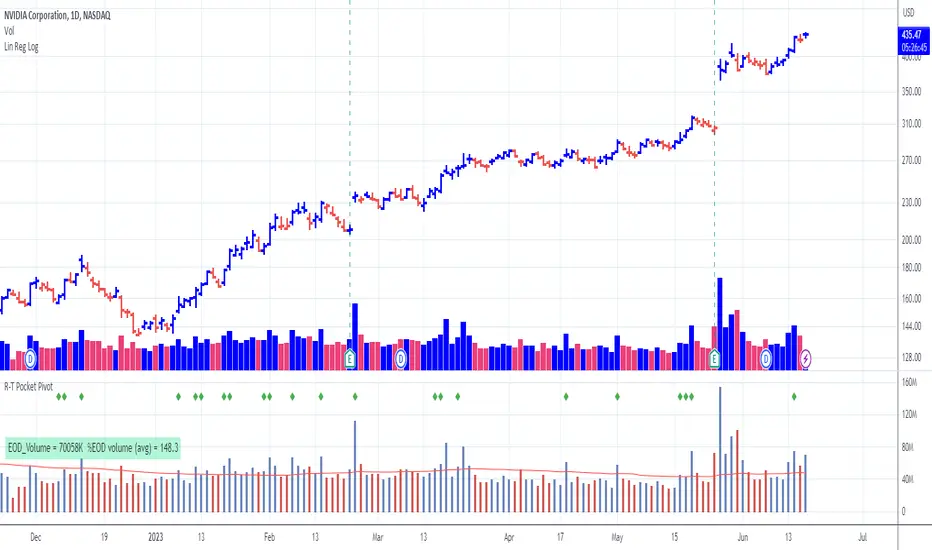
Pocket Pivot with extrapolated Volume and Moving AveragesThe script shows historical pocket pivots, much as other scripts with a green diamond shape on the volume pane.
When the market is open, the current bar, however, is extrapolated to the end of the day using a sixth-order polynomial.
Thus real-time pocket pivots are shown. To work properly, the user must input a time-zone offset parameter; the default is west coast USA.
Time-zone offset is -12 hours to +12 hours compared to the NYSE exchange time zone (USA west coast: -3.)
The volume extrapolation polynomial is based on a historical NASDAQ intraday volume model developed locally by a team.
Only ten-day lookback pocket pivots are computed as defined initially by Dr. Chris Kacher. (The default lookback can be changed by the user.)
Only pocket pivots are shown where the low of the daily bar is within user-defined proximity to the 50-day moving average or 10-day moving average (for continuation pocket pivots.)
VWAP Bands - MultiTF and anchoredThe script has traditional VWAP for two different timeframes along with an option to anchor them to a particular bar. VWAP bands are also included in the script. The bands and VWAP act as hidden support/resistance for the scrip and are useful for intraday trading.

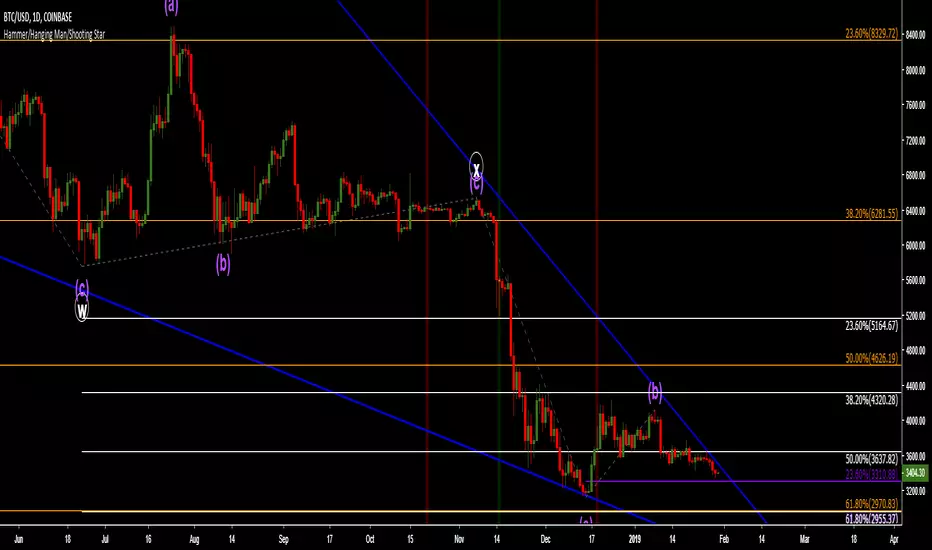
Hammer/Hanging Man/Shooting StarThe script highlights the Hammer, Hanging Man, and Shooting Star candlesticks on the main chart screen. Please use an oscillator that shows oversold and overbought conditions with this script.
Edge of MomentumThe script was designed for the purpose of catching the rocket portion of a move (the edge of momentum).
Long
--When RSI closes over 60, take long order 1 tick above that bar. The closed bar above RSI 60 will be colored "green" or whatever color the user chooses. (RSI > 60)
--On a long position, exit will be a closed bar below the ema (low, 10) . The closed bar below the ema will be colored "yellow." (Price < ema)
--Note: On a long position there is no need to exit when a closed bar is colored "purple." RSI is just below 60 but above 40. Pullback or chop
Short
--When RSI closes below 40, take a short order 1 tick below that bar. The closed bar below RSI 40 will be colored "red." RSI<40)
--On a short position, exit will be a closed bar above the ema (low, 10). The closed bar above the ema will be colored "purple." (Price > ema)
--Note: On a short position there is no need to exit when a closed bar is colored "yellow."
Note: You may see a series of purple and yellow bars, that is simply chop. I define chop as RSI moving between 60 and 40.
Trade should only be taken above green colored candle(long) and below red colored candle (short). No position should be taken off yellow or purple candle (chop)
Again this is designed to catch the momentum part of a move, and to help reduce some entries during chop. It is a simple systems that beginning traders can use and profit from.
Note: I don't no shit about coding scripts I just learn from reading others.
Enjoy. If you decide to use please drop me a line...suggestions/comments, etc.
Best of luck in all you do.

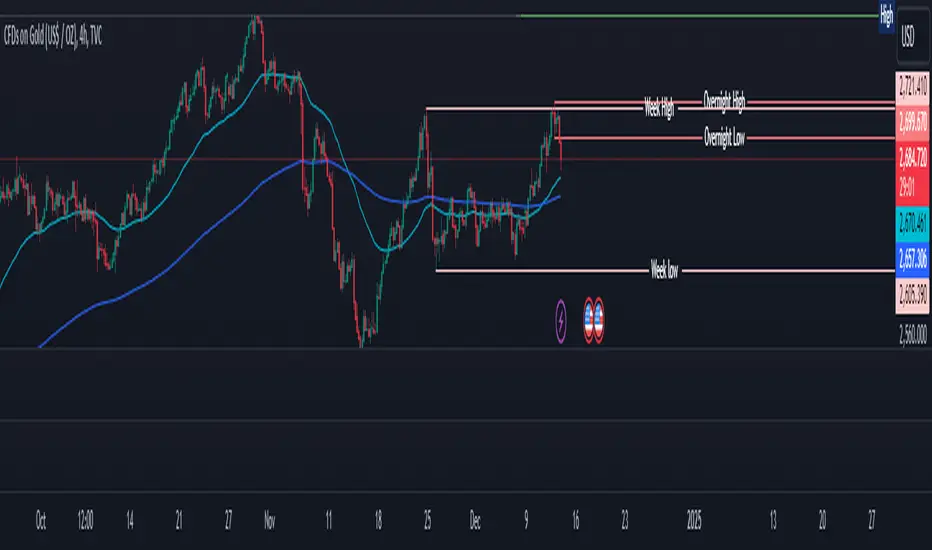
Overnight High/LowThe script identifies the Overnight High (the highest price) and Overnight Low (the lowest price) for a trading instrument during a specified overnight session. It then plots these levels on the chart for reference in subsequent trading sessions.
Key Features:
Time Settings:
The script defines the start (startHour) and end (endHour + endMinute) times for the overnight session.
The session spans across two calendar days, such as 5:00 PM (17:00) to 9:30 AM (09:30).
Tracking High and Low:
During the overnight session, the script dynamically tracks:
Overnight High: The highest price reached during the session.
Overnight Low: The lowest price reached during the session.
Reset Mechanism:
After the overnight session ends (at the specified end time), the script resets the overnightHigh and overnightLow variables, preparing for the next session.
Visual Representation:
The script uses horizontal dotted lines to plot:
A green line for the Overnight High.
A red line for the Overnight Low.
These lines extend to the right of the chart, providing visual reference points for traders.
How It Works:
Session Detection:
The script checks whether the current time falls within the overnight session:
If the hour is greater than or equal to the start hour (e.g., 17:00).
Or if the hour is less than or equal to the end hour (e.g., 09:30), considering the next day.
The end minute (e.g., 30 minutes past the hour) is also considered for precision.
High and Low Calculation:
During the overnight session:
If the overnightHigh is not yet defined, it initializes with the current candle's high.
If already defined, it updates by comparing the current candle's high to the existing overnightHigh using the math.max function.
Similarly, overnightLow is initialized or updated using the math.min function.
Post-Session Reset:
After the session ends, the script clears the overnightHigh and overnightLow variables by setting them to na (not available).
Line Drawing:
The script draws horizontal dotted lines for the Overnight High and Low during and after the session.
The lines extend indefinitely to the right of the chart.
Benefits:
Visual Aid: Helps traders quickly identify overnight support and resistance levels, which are critical for intraday trading.
Automation: Removes the need for manually plotting these levels each day.
Customizable: Time settings can be adjusted to match different markets or trading strategies.
This script is ideal for traders who use the overnight range as part of their analysis for breakouts, reversals, or trend continuation strategies.
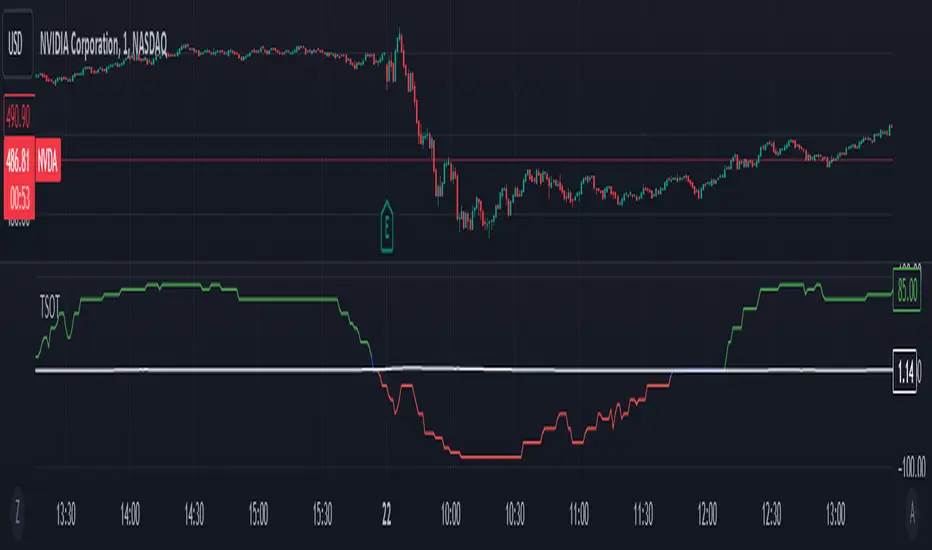
Trend Strength Over TimeThe script serves as an indicator designed to assess and visualize trend strength and Volume strength over time. It employs a variety of calculations and conditions to offer insights into both bullish and bearish market trends. Let's explore the key conceptual elements of the code.
Trend Strength Conditions:
The script defines conditions to assess trend strength based on a comparison between each calculated percentile value and the highest high (bullish) or lowest low (bearish). Separate conditions are established for each percentile length, allowing for a nuanced understanding of trend dynamics across different timeframes.
Counting Bull and Bear Trends:
To quantify the strength of bullish and bearish trends, the script maintains counts for the number of conditions that are true for each. This count-based approach provides a quantitative measure of trend strength.
Weak Bull and Bear Counts:
Recognizing that trends are not always clear-cut, the script introduces the concept of weak trends. It counts instances where the percentiles fall between the highest high and lowest low, indicating a potential weakening of the prevailing trend.
Bull and Bear Strength:
Bull and bear strengths are calculated based on the counts, with adjustments made for weak trends. This step provides a more nuanced and comprehensive assessment of trend strength by considering both strong and weak signals.
Current Trend Value:
The culmination of these calculations is the determination of the current trend value. This value represents the balance between bullish and bearish forces, offering a dynamic indicator of the market's prevailing sentiment.
Volume Strength Calculation:
In addition to price-based indicators, the script incorporates volume strength as a crucial element. This is calculated using the simple moving averages (SMAs) of volume over different lengths, normalized relative to the SMA over a length of 144. Volume strength adds a layer of confirmation or divergence to the price-based trend analysis.
Color Change:
To facilitate quick and intuitive interpretation, the script dynamically changes the color of the plotted line on the chart based on the current trend value. Green indicates a bullish trend, red indicates a bearish trend, and blue suggests a neutral or indecisive market.
Plotting:
The script uses the plot function to visually present the calculated trend strength and volume strength on the chart. This visual representation aids traders in making informed decisions based on the identified trends and their strengths.
Volume Strength: A Detailed Explanation
In the context of the provided script, volume strength is a critical component used to assess the strength of a market trend. It provides insights into the level of participation and commitment of market participants, offering a complementary perspective to traditional price-based indicators. Let's delve into the concept and practical applications of volume strength.
Calculation of Volume Strength:
The script calculates volume strength by considering the simple moving averages (SMAs) of volume over different time periods (13, 21, 34, 55, 89). These individual SMAs are then normalized relative to the SMA over a more extended period of 144. The weights assigned to each SMA in the calculation are defined in the variable VCF (Volume Correction Factor).
Calculation of Volume Strength with Weights: The weights assigned to each SMA in this calculation are crucial for emphasizing the significance of shorter-term volume movements relative to a longer-term baseline.
Interpretation of Weights:
The choice of weights reflects the relative importance of shorter-term volume movements compared to longer-term trends. In this script, shorter-term SMAs (13, 21, 34, 55, 89) are assigned decreasing weights, while the longer-term SMA (144) serves as the baseline.
Shorter-term SMAs with higher weights may have a more immediate impact on the volume strength calculation. This implies that recent changes in volume carry more weight in assessing the current market conditions.
The decreasing weights for shorter-term SMAs might indicate that, as the timeframe lengthens, the significance of recent volume movements diminishes in relation to the longer-term trend. This approach allows for a focus on both short-term volatility and longer-term stability in volume patterns.
The purpose of normalization is to emphasize the current volume's significance in comparison to its historical context. This can help identify abnormal volume spikes or sustained increases in trading activity, which may indicate the strength or weakness of a trend.
Interpretation and Practical Use:
Confirmation of Trend:
Rising volume during an uptrend can validate the strength of the upward movement, suggesting that a significant number of market participants are actively buying. Conversely, decreasing volume during an uptrend might indicate weakening interest and a potential reversal.
In a downtrend, increasing volume on downward price movements reinforces the strength of the trend. A decrease in volume during a downtrend may suggest a potential weakening or exhaustion of the downward momentum.
Divergence Analysis:
Divergence occurs when there is a disagreement between the price movement and the corresponding volume. For example, if prices are rising but volume is declining, it could signal a lack of conviction in the upward movement, and a reversal might be imminent.
Conversely, if prices are falling, but volume is decreasing as well, it might suggest that the downward momentum is losing steam, and a potential reversal or consolidation could be on the horizon.
In conclusion, volume strength analysis provides traders with a powerful tool to gauge the conviction behind price movements. By incorporating volume data into the technical analysis, one can make more informed decisions, enhance trend identification, and improve risk management strategies.
Whale Supertrend (V1.2)The script "Whale Supertrend (V1.2)" is an advanced trend indicator that uses multiple Supertrends with different factors to determine entry and exit points in the market. The Supertrend is a popular indicator that combines price and volatility to help identify trend direction. The script displays buy and sell signals based on the confluence of Supertrends.
How the script works
Configuring Supertrends
The script configures six Supertrends with different factors (factor, factor1, factor2, factor3, factor4, factor5) while using the same ATR period (atrPeriod = 10).
Supertrend 1: factor = 3
Supertrend 2: factor1 = 4
Supertrend 3: factor2 = 6
Supertrend 4: factor3 = 9
Supertrend 5: factor4 = 13
Supertrend 6: factor5 = 18
For each Supertrend, the bullish (blue) and bearish (purple) trend conditions are plotted on the chart.
Signal Calculation
The script calculates the number of Supertrends in bullish and bearish trend:
bullishCount: Number of Supertrends indicating a bullish trend.
bearishCount: Number of Supertrends indicating a bearish trend.
Signal Detection
The script triggers a buy or sell signal when at least three of the six Supertrends indicate the same trend:
Buy Signal (buySignal): Triggers when bullishCount is greater than or equal to 3.
Sell Signal (sellSignal): Triggers when bearishCount is greater than or equal to 3.
To avoid repetition, signals are only displayed when the state changes:
triggerBuy: Buy signal only when buySignal becomes true for the first time.
triggerSell: Sell signal only when sellSignal becomes true for the first time.
Candle Coloring:
Candles now change color based on signals:
Green: When a Buy Signal is active.
Red: When a Sell Signal is active.
This provides a clearer visualization of market trends directly on the chart.
Dynamic Settings for Supertrends:
You can customize the ATR Period and Factor for each of the 6 Supertrends via the settings panel.
Each Supertrend has independent parameters:
ATR Period: Controls the ATR calculation period.
Factor: Adjusts the Supertrend sensitivity.
Benefits:
Enhanced Readability: Candle colors help identify buy and sell zones at a glance.
Greater Customization: Tailor Supertrend settings to your trading strategy or market conditions.

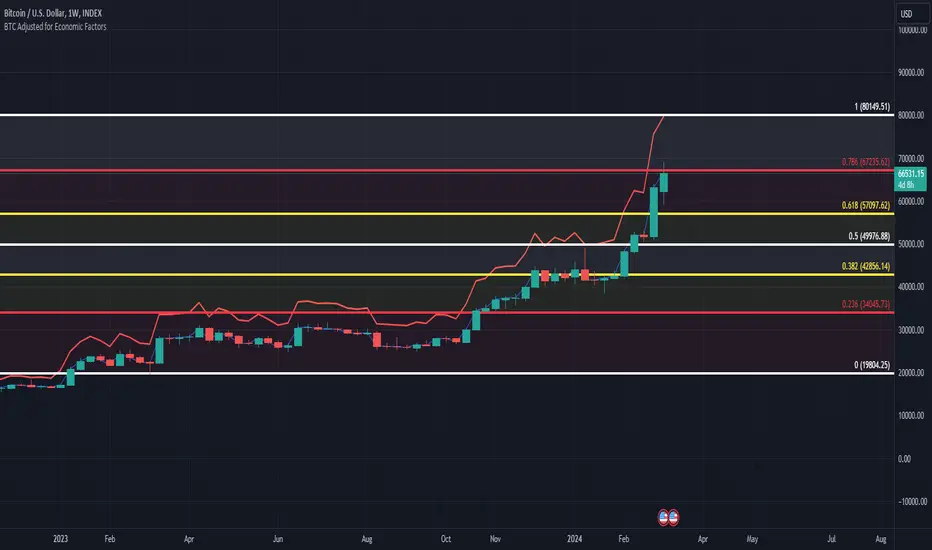
BTC/USD Inflation priced in! ~Period 2009 - 2023 (by TAS)The script creates a custom indicator titled "BTC Adjusted for Economic Factors.
Adjusted BTC Price is plotted in red, making it more prominent. The adjusted price is Bitcoin's historical closing prices adjusted for cumulative inflation over time, based on the Core Consumer Price Index (CPI) annual inflation rates from 2009 onwards.
The script calculates the adjusted price of Bitcoin by taking into account the effect of inflation on its value. It uses annual CPI rates for each year from 2009 to 2022 to calculate a cumulative inflation factor. The script assumes a placeholder inflation rate of 2.5% for 2023, indicating that this value should be updated when the actual rate is available. The script suggests adding CPI rates for additional years as they become available to maintain the accuracy of the adjustment.
Here's a breakdown of how the script works:
Core CPI Annual Inflation Rates: It starts by defining the annual inflation rates for each year from 2009 to 2022, expressed as a percentage divided by 100 to convert to a decimal.
Cumulative Inflation Calculation: The script calculates cumulative inflation starting from the year 2009 up to the current year. For each year that has passed since 2009, it multiplies the cumulative inflation factor by (1 + cpiRate), where cpiRate is the inflation rate for that year. This effectively compounds the inflation rate over time.
Adjusting Bitcoin's Price: The script then adjusts Bitcoin's closing price (close) for the calculated cumulative inflation to get the adjusted price (adjustedPrice).
Plotting the Prices: Finally, it plots both the original and the adjusted Bitcoin prices on the chart, allowing users to visually compare how inflation has theoretically impacted Bitcoin's value over time.
--------------------------------------------------------------------------------------------------
Important to notice, Fib. Retracements from the 2017 cycle top to the recent top (¬80K) doesn't look invalidated.
--------------------------------------------------------------------------------------------------
Inputs and feedback are welcome!
PortfolioThe script’s purpose is to measure one’s net worth based on manual input. It can also be used to establish other “unthought-of” ways of analyzing charts, eg. to group different assets and watch for convergence.
“How to use”
First, decide which “currency” you want to measure all your assets against. You can display the portfolio value in a cryptocurrency or something else.
Add assets:
Write a description (eg. Bitcoin).
Set the amount you have.
Link to a chart that measures against your “currency”
It’s possible to add multiple assets in different “accounts” or “groups”. The portfolio value should then display the value of all those assets combined.
How is PnL measured?
You can measure PnL for the entire portfolio and every “group” individually. You are in charge of which level to measure from. You can for instance type in your current portfolio value and reset it on a monthly basis, or perhaps set a “floor” you want to avoid reaching. PnL is displayed in “currency” and percent change measured from the levels chosen by you.
Script information
To make the indicators published by this account fit together, look good, and easily managed. We had to include some code that is also used in the (closed-source) indicators “Long Position” and “Short Position”. This code is used for distancing and placing labels. It is a volatility-based code that looks back at the previous price action and determines a chart- and timeframe-specific volatility. Not “timeframe-specific” in the sense that some timeframes have special calculations, more that values will most likely be different depending on the “calculation environment”. The main functionality of this script is not about label placements, so we do not think this is a very big deal regarding originality for our other indicators. To keep our other indicators original and to not give away key code blocks with multi-functional value , we have chosen to also have this script published as closed-source.
Furthermore, the script requests data from other symbols based on the user’s input. Thereafter, it calculates and concatenates the percentage and value from the initial inputs. To better understand the script as a whole it would probably be useful to read the “How to use” section of this publication.

Tug-of-War Fast/Slow Technical IndicatorThe script Tug-of-War (ToW) Fast/Slow has a couple of lines (red and purple) and areas (purple and greenish) which give the trend. It also has one line (blue) and dots (green) that give the up-and-down swing.
HOW THE INDICATOR WORKS
It is based on moving averages run on normal OHLC bars, Heikin Ashi bars as well as customized bars (which modify the open/high/low/close values similar to how Haikin Ashi bars do). These moving averages are weighted by volume and related to each other (for example differences are calculated) to produce the final lines. Since the script requires volume, it may not work for tickers which don't have volume (however for some tickers the script uses a proxy-volume so that they work; for example it uses the SPY volume for VIX). There is a different but similar script that I'll be publishing (ToW Simple) which doesn't use volume and runs on any ticker.
HOW TO SETUP THE INDICATOR
The indicator can be run on "close" prices as well as "open", "high", "low" and several mini-max modes ("MM ..."). They pick highs and lows (minim and maxim values, hence the mini-max name) to generate the indicator lines. See the drop down box options under "Adjust Close Type" (the very fist options in the script settings). The multiple MM modes use different formulas to calculate the mini-max values. The more significant MM modes are MM ZZ (zig-zag), MM HL/HL (determines highs and lows based on highs and lows), MM HL/C (determines highs and lows based on close) and MM Close. Note: if the MM ZZ mode show you the highs for the current bar and you actually want the lows (or vice versa) check "MM ZZ Reverse".
The indicator has two fast lines:
the green dots (called F1 since it's the 1st Fast line, actually dots)
the blue line (called F2--the 2nd Fast line)
They are called "fast" because they move up and down faster. In previous iterations of the script I called them "swing lines" since they capture the prices swing up and down. The blue line is the more significant one (since the green one I set, by default to dots instead of an actual line).
The indicator has two slow lines:
the purple line (called S1 since it's the 1st Slow line)
the blue line (called S2--the 2nd Slow line)
They move slower than the fast line and they are better at determining the trend.
The order of lines, from fast to slow, is: F1 (green), F2 (blue), S1 (purple) and S2 (red).
The indicator also has two areas:
the greenish area (called FA since it's the Fast Area)
the purple area (called SA since it's the Slow Area)
Additional lines (but less significant are displayed if you uncheck the "Clean look" option).
The script allows to display up to for sets of lines (see the top "Adjust Close Type (Set #)" options). For example one set may show "Highs" and the other "Lows" or "Close" and "MM HL/HL". Additionally it can run in multi-set mode when it shows the chosen one line (F1, F2, S1, S2, FA, SA) for each OHLC (open, high, low, close). See "Only Show Related Lines" option. In this display purple is the line for Open, green is the line for High, red is the line for Low and black is the line for Close.
The indicator also has a custom mode (see the "Enable custom bars" checkbox and the options following it). With it you can change the open/high/low/close value (see "Custom #1 OHLC to Modify") of a bar ("Custom #1 Index To Modify" determines which bare to modify, 0 being the most recent bar). Then "Custom #1 Modifier Type" specifies to use open/high/low/close value of the same or different bar (use "Custom #1 Modifier Index/Value ..." to choose which bar's OHLC value to use for the custom value; 0 means the O/H/L/C value of the same bar as the one being modified; 1 means previous bar, etc.). If "Custom" is selected instead (under Modifier Type) then you can enter the custom value in the "Custom #1 Modifier Index/Value ..." field. This will show you how the indicator lines look like if the price was different. Three different bars can be modified this way. You can try different custom values and see for what price value one of the lines reaches a high or low point. That is an estimate of how far the price may go. Note: the indicator values depends depends on all OHLC values (plus volume) not just on the one chosen. That is, if the indicators is based on close values it is still affected to some extent by high, low and volume. Therefore the price value determined using the custom mode may not be exact but only a rough estimate (and the bigger changes in OHLC the bigger affect on the indicator and the actual price may not be exactly what was calculated using the custom mode.
HOW TO USE THE INDICATOR
Strategies and tools that apply to price such as resistance and support levels and trend lines, pitchforks (particularly Schiff pitchforks in case of the indicator) also apply to these lines. Because the indicator lines are within a range it is generally easier and faster to see and find such support/resistance levels and trend lines.
Additionally, the lines or the areas crossing the 0 line often indicate a change in trend (however if earlier indicator highs/lows bounce off around the 0 line that may happen this time around as well). The more significant 0 crossing is for the slow lines (red first and then purple) as well as the areas.
The slow lines and the areas, as mentioned already, show the trend (in previous iterations of the indicator I called them direction lines).
The fast lines (blue line, green dots) show the swing, as mentioned earlier. They often swing up and down. When they reach a high (you can thin of it as overbought) they may move back down on the next bar (or vice-versa when reaching a low). However, sometimes they don't swing but rather move in a line closer to a straight line (more like the slow lines). That indicates that the trend is stronger.
The fast lines can also indicate the trend by looking if their highs and/or lows are trending up or down. Thus, if the highs and lows are trending down then it's likely the price will go down.
Another thing to look at is divergence between the price and the slow lines or the high/lows trend of the fast lines (that I mentioned above). If the price is going up but the these are trending down then over the same bars then the price may be coming closer to a reversal.
STRATEGIES
Swing-in-trend. Find a ticker with the slow lines showing an upward trend (i.e., the red line crossing 0 or being above 0) and a the slow line (such as the blue line) reaching a previous low level (draw support levels and/or trend lines to determine that). Go long when the fast line reaches the support level or bottom trendline. The expectation is that the price will move up by the close of the next bar (when the position should normally be closed). The "go-short" setup is just reversed (slow lines trending down and the fast lines reaching high levels). You can use the "High", "Low", "MM ZZ" or one of the other MM modes instead of "Close" to get a better entry and exist point (in this case you enter when the the "Low" or "MM ZZ" modes reached a low and you enter if the "High" or "MM ZZ" reached a high or else exit at close of the next bar).
Trend-on-swing. When the red line is about to cross or just crossed the 0 line and wait for the swing line to go down first (you can use "High", "Low" or an MM mode, as explained dabove, for a better entry point) and then you enter the position and exit when either the slow (red) line reaches a resistance level, it crosses 0 the other way or when the fast line reaches a very high resistance level. This strategy will take longer, it won't be closed on the next bar.
Mini-max strategy. This is a new strategy I've developed. It uses MM ZZ mode (and a second MM ZZ set to "reverse") as well as "High", "Low" and "MM HL/HL" mode. I basically draw resistance and support lines on these, usually 2-3 lines for high and the same for low, for multiple tickers that seem a good match (they show a nice, consistent up/down pattern for MM ZZ). When the F2/blue lines reaches one of the horizontal lines further from the 0 lines (I setup alerts for this), then I enter expecting a move in the opposite direction. If it reaches the 2nd or 3rd low horizontal line then I go long. Then on the next bar when the F2 line reaches the 1st high horizontal line then I close the position (alternatively, I close half and keep half for when the second high horizontal line is reached). Alternatively, I may close the same bar, when the reversed MM ZZ setup reaches the 1st high horizontal line. I usually use this setup on weekly charts and use weekly options but it can be used on other charts such as daily charts as well.
I recommend to setup alerts on the indicator. After you draw a horizontal line or a trend line and you select it, its bar has a clock icon with a "+" sign. If you click on it you can setup an alert. In the setup dialog, under "Condition" select the indicator and then select the line of the indicator (such as "F2 (f_s/Blue)") then select "Once Per Bar" under "Options" (that's my recommendation, it will alert you only one time per bar). Finally customize the message for example: "ZZ: F2/blue /lo hl 1/3, TQQQ, 1D" (which means it's for MM ZZ mode when F2 (blue) line intersects the 1st (out of 3) low horizontal line (HL) and it's for TQQQ on 1D chart. When I use the reverse mode for ZZ then I write: "ZZr: ..."
In the chart above, the first indicator shows the "Close" mode and the second the "MM ZZ" mode (along with 2 levels for high and low).

Enhanced BTC Order Block IndicatorThe script you provided is an "Enhanced BTC Order Block Indicator" written in Pine Script v5 for TradingView. It is designed to identify and visually mark Order Blocks (OBs) on a Bitcoin (BTC) price chart, specifically tailored for a high-frequency scalping strategy on the 5-minute (M5) timeframe. Order Blocks are key price zones where institutional traders are likely to have placed significant buy or sell orders, making them high-probability areas for reversals or continuations. The script incorporates customizable filters, visual indicators, and alert functionality to assist traders in executing the strategy outlined earlier.
Key Features and Functionality
Purpose:
The indicator detects bullish Order Blocks (buy zones) and bearish Order Blocks (sell zones) based on a predefined percentage price movement (default 0.5–1%) and volume confirmation.
It marks these zones on the chart with colored boxes and provides alerts when an OB is detected.
User-Configurable Inputs:
Price Move Range: minMovePercent (default 0.5%) and maxMovePercent (default 1.0%) define the acceptable price movement range for identifying OBs.
Volume Threshold: volumeThreshold (default 1.5x average volume) ensures OB detection is backed by significant trading activity.
Lookback Period: lookback (default 10 candles) determines how many previous candles are analyzed to find the last candle before a strong move.
Wick/Body Option: useWick (default false) allows users to choose whether the OB zone is based on the candle’s wick or body.
Colors: bullishOBColor (default green) and bearishOBColor (default red) set the visual appearance of OB boxes.
Box Extension: boxExtension (default 100 bars) controls how far the OB box extends to the right on the chart.
RSI Filter: useRSI (default true) enables an RSI filter, with rsiLength (default 14), rsiBullishThreshold (default 50), and rsiBearishThreshold (default 50) for trend confirmation.
M15 Support/Resistance: useSR (default true) and srLookback (default 20) integrate M15 timeframe swing highs and lows for additional OB validation.
Core Logic:
Bullish OB Detection: Identifies a strong upward move (0.5–1%) with volume above the threshold. It then looks back to the last bearish candle before the move to define the OB zone. RSI > 50 and proximity to M15 support/resistance (optional) enhance confirmation.
Bearish OB Detection: Identifies a strong downward move (0.5–1%) with volume confirmation, tracing back to the last bullish candle. RSI < 50 and M15 resistance proximity (optional) add validation.
The OB zone is drawn as a rectangle from the high to low of the identified candle, extended rightward.
Visual Output:
Boxes: Uses box.new to draw OB zones, with left set to the previous bar (bar_index ), right extended by boxExtension, top and bottom defined by the OB’s high and low prices. Each box includes a text label ("Bullish OB" or "Bearish OB") and is semi-transparent.
Colors distinguish between bullish (green) and bearish (red) OBs.
Alerts:
Global alertcondition definitions trigger notifications for "Bullish OB Detected" and "Bearish OB Detected" when the respective conditions are met, displaying the current close price in the message.
Helper Functions:
f_priceChangePercent: Calculates the percentage price change between open and close prices.
isNearSR: Checks if the price is within 0.2% of M15 swing highs or lows for support/resistance confluence.
How It Works
The script runs on each candle, evaluating the current price action against the user-defined criteria.
When a bullish or bearish move is detected (meeting the percentage, volume, RSI, and S/R conditions), it identifies the preceding candle to define the OB zone.
The OB is then visualized on the chart, and an alert is triggered if configured in TradingView.
Use Case
This indicator is tailored for your BTC scalping strategy, where trades last 1–15 minutes targeting 0.3–0.5% gains. It helps traders spot institutional order zones on the M5 chart, confirmed by secondary M1 analysis, and integrates with your use of EMAs, RSI, and volume. The customizable settings allow adaptation to varying market conditions or personal preferences.
Limitations
The M15 S/R detection is simplified (using swing highs/lows), which may not always align perfectly with manual support/resistance levels.
Alerts depend on TradingView’s alert system and require manual setup.
Performance may vary with high volatility or low-volume periods, necessitating parameter adjustments.

OrangeCandle 4EMA 55 + Fib Bands + SignalsThe script is a TradingView indicator that combines three popular technical analysis tools: Exponential Moving Averages (EMAs), Fibonacci bands, and buy/sell signals based on these indicators. Here’s a breakdown of its features:
1. EMA Settings and Calculation:
The script calculates and plots several Exponential Moving Averages (EMAs) on the chart with different lengths:
Short-term EMAs: EMA 9, EMA 13, EMA 21, and EMA 55 (used for tracking short-term price trends).
Long-term EMAs: EMA 100 and EMA 200 (used to analyze longer-term trends).
These EMAs are plotted with different colors to visually distinguish between the short-term and long-term trends.
2. Fibonacci Bands:
The script calculates Fibonacci Bands based on the Average True Range (ATR) and a Simple Moving Average (SMA).
Fibonacci factors (1.618, 2.618, 4.236, 6.854, and 11.090) are used to determine the upper and lower bounds of five Fibonacci bands.
Upper Fibonacci Bands (e.g., fib1u, fib2u) represent resistance levels.
Lower Fibonacci Bands (e.g., fib1l, fib2l) represent support levels.
These bands are plotted with different colors for each level, helping traders identify potential price reversal zones.
3. Buy and Sell Signals:
Long Condition: A buy signal occurs when the price crosses above the EMA 55 (long-term trend indicator) and is above the lower Fibonacci band (support zone).
Short Condition: A sell signal occurs when the price crosses below the EMA 55 and is below the upper Fibonacci band (resistance zone).
These conditions trigger visual signals on the chart (green arrow for long, red arrow for short).
4. Alerts:
The script includes alert conditions to notify the trader when a long or short signal is triggered based on the crossover of price and EMA 55 near the Fibonacci support or resistance levels.
Long Entry Alert: Triggers when the price crosses above the EMA 55 and is near a Fibonacci support level.
Short Entry Alert: Triggers when the price crosses below the EMA 55 and is near a Fibonacci resistance level.
5. Visualization:
EMAs are plotted with distinct colors:
EMA 9 is aqua,
EMA 13 is purple,
EMA 21 is orange,
EMA 55 is blue (with thicker line width for emphasis),
EMA 100 is gray,
EMA 200 is black.
Fibonacci bands are plotted with different colors for each level:
Fib Band 1 (upper and lower) in white,
Fib Band 2 in green (upper) and red (lower),
Fib Band 3 in green (upper) and red (lower),
Fib Band 4 in blue (upper) and orange (lower),
Fib Band 5 in purple (upper) and yellow (lower).
Summary:
This script provides a comprehensive strategy for analyzing the market with multiple EMAs for trend detection, Fibonacci bands for support/resistance, and signals based on price action in relation to these indicators. The combination of these tools can assist traders in making more informed decisions by providing potential entry and exit points on the chart.

Harish Algo 2The script "Harish Algo 2" is a Pine Script-based TradingView indicator that automatically identifies significant trendlines based on fractal points and tracks price interactions with those trendlines. Key features include:
Fractal Detection: The script identifies fractal highs and lows, using a configurable fractal period, to serve as pivot points for generating trendlines. Fractal highs are marked in blue, and fractal lows are marked in red.
Dynamic Trendlines: It draws trendlines between consecutive fractal points, with a limit on the maximum number of active trendlines. The trendlines can be extended either in both directions or to the right, as per user input. The line width can also be customized.
Support/Resistance Counting: Each trendline tracks how many times the price interacts with it. If the price approaches the line from above and touches or stays near it, the line is considered a support. If the price approaches from below, it is considered a resistance. These counts are used to modify the trendline's color and appearance.
Trendlines with 2 support interactions turn green.
Trendlines with 2 resistance interactions turn red.
Trendlines with 3 or more interactions turn black.
Trendline Styling: Trendlines that extend over a long period (more than 100 bars) change to a dotted style to highlight their persistence.
Break Detection: The script monitors if the price crosses a trendline, signaling a potential breakout or breakdown. Once a trendline is broken, it stops extending further.
Trendline Removal: The script ensures that only a limited number of trendlines are active at a time. If the maximum number of trendlines is reached, the oldest trendline is removed to make space for new ones.
This indicator is designed to help traders visualize important trendlines, spot potential support and resistance levels, and detect breakouts or breakdowns based on price movement.
